
Requirements
Each student must participate in a class survey project. This project requires the student to analyze data from a survey that has been administered to undergraduate students at Douglas College using MS Excel.
Project Details
The survey can be found at: https://docs.google.com/forms/d/1LsbtT5uHM999Y3kPrGlFLiTYvZbU9sSgUWxy8RWgKFs/viewform?usp=send_form
Surveys consist of 6 demographic questions, 9 behavioural questions and 5 attitudinal questions.
- Demographic Questions: These are: 1) Gender, 2) Age in years, 3) Ethnicity, 4) Number of courses this semester, 5) Number of courses total 6) Area of study.
- Behavioral Questions: These are questions about what the respondent actually does.There are 8 questions:1) Hours per day on social media, 2) Hours per day Online (but not social media), 3) Hours per day watching TV, 4) Hours per day in class 5) Hours per day working in a paid job, 6) Hours per day doing homework, 7) Hours per day exercising, 8) Hours per day commuting, 9) What is your GPA?
- Attitudinal Questions: These are questions about what the respondent thinks or believes. There are 5 questions: 1) What grade level are you trying to achieve? 2) What are your educational goals? 3) How much time should you spend studying for a midterm? 4) Belief in the post-secondary educational system? 5) Education is important to life success?
The survey has been administered to participants using the Online survey.
Survey results must be analyzed and reported as follows:
- A table (table 1) showing frequency distributions and means and SD's (where appropriate) for demographic variables. (2 marks)
- A description of the responses to attitudinal questions broken down by gender. This description must include a line graph of means and 95% confidence intervals for male means. (4 marks)
- A write-up including a title page, introduction, methods section and analysis section (4 marks).
- Tests of the statistical significance of differences for each attitudinal question by gender. Each test must include an assessment of the extent to which the assumptions of the test were met. (3 marks)
- The calculation of Cohen's d with gender as the IV and each attitudinal question as the DV. (2 marks)
- ANOVA for each behavioural question with number of courses as the IV. Include a line graph of means for each of the 4 levels of the number of courses variable. (3 marks)
- Eta Squared for each behavioural question with number of courses as the IV. (2 mark)
- The calculation of Pearson r between attitudinal questions 3 and 5. A test of Rho=0 for this Pearson r and a scatter plot of the data. (2 marks)
- A write-up including a summary section in which the results are summarized in writting. (3 marks).
Results must be written-up in an analysis report. This report is not an APA style report. It must include:
1) A title page listing the name of the writer of the report, the date of submission, the person the report is being submitted to, a title for the project. All pages should include a page number and report title in a header.
2) An introduction. This section includes:
i) A statement of what the project is about
ii) An overall description of the purpose of the project
iii) A general statement of what the report contains
The introduction should be no more than 8 sentences long.
3) A methods section. This section includes a description of the following:
i) The method of administration of the survey
ii) The number of respondents
iii) A general breakdown of the demographics of the respondents (Table 1)
iv) A description of any incentives that were given to participate
v) The method used to ensure anonymity
vi) The number of questions on the survey and the style of question (closed-ended, likert, etc.)
vii) Length of time required to complete the survey
4) An analysis section. This section includes:
i) A statement of the way in which data were entered in to computer software and the software used
ii) A statement of how the data were audited
iii) Tables and graphs of the results as described above
iv) A written description of what the tables and figures show
5) A summary section: This section includes:
i) A written summary of the most important results
ii) A description of the real-world or practical implications of the results
iii) A statement of any methodological concerns you might have about the accuracy of the results or the validity of the conclusions that have been drawn from the results
Tables & Figures
Unlike APA all tables and figures should be inserted in to the body of the report where they are appropriate. Similar to APA, all tables and figures should be numbered (i.e., Table 1, Figure 1, etc.) and all should have a title that describes succinctly what the table/figure shows.
For example, a table might be contained in the body of the report as follows:
Table 1 contains a demographic description of the sample. The majority of respondents were male and were Oriental or Indian.
Table 1: Demographic Breakdown of Survey Respondents
Variable |
Level |
Frequency |
Percent |
Mean |
SD |
|
|
|
|
|
|
Gender |
Male |
24 |
60 |
N/A |
N/A |
Female |
16 |
40 |
|
|
|
|
|
|
|
|
|
Ethnicity |
Caucasian |
2 |
5 |
|
|
Oriental |
16 |
40 |
N/A |
N/A |
|
Indian |
14 |
35 |
|
|
|
Other |
8 |
20 |
|
|
|
|
|
|
|
|
|
|
< 20 |
6 |
15 |
|
|
|
21-35 |
8 |
20 |
|
|
Age |
36-50 |
5 |
12 |
31.2 |
8.4 |
|
51-65 |
18 |
47 |
|
|
|
> 65 |
3 |
7 |
|
|
A figure for the results of t-tests and effect sizes must be displayed as follows:
Figure 1: Mean Scores for Males and Females on all Attitudinal Questions
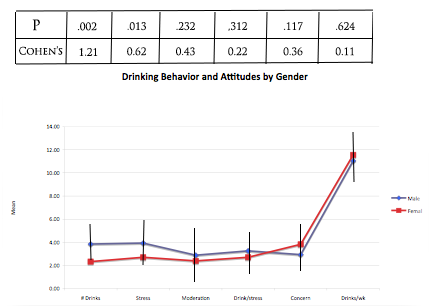
Males scored statistically significantly higher than females on ideal number of drinks per week (p=.002), etc. Gender differences were largest for ideal number of drinks per week (Cohen’s d= 1.21), etc.
95% confidence intervals for male means should be displayed on this graph as shown above.
A similar figure should be included for the results of mean scores at each level of the "number of courses" IV. The p-value from the ANOVA and Eta squared should be included in this figure.